
The subject of statistics is new to many chemists and often requires a different way of thinking. The best and most useful way to learn statistics is to practice. The exercises in this Web Tutorial are meant to stimulate thinking about the material and provide a deeper insight. I hope that this will be a convenient and pleasant way of learning for you.
Course Sheets and Study Guide
The powerpoint sheets and the study guide can be downloaded from Brightspace.
Why are statistics important?
The results of experiments appear to show that a difference can be observed if experiments were carried out by different students or with different experimental procedures. These differences are caused by measurement errors which in their turn can have many different causes. Usually, a number of the uncertainties in the results can be explained and even quantified in terms of standardized and known instrumental uncertainties (error propagation). These standard uncertainties are written on the instruments. The other part, however, cannot be fully identified or quantified and is usually caused by the experience of the student and random events.
In these cases, statistics can help to deal with measurement errors (uncertainties) and characterize those. An important statistical tool for this task is the use of the normal distribution.
Types of measurement errors
Measurement errors can be divided into two categories: random and systematic errors. If, for example, the alcohol level in a blood sample has to be determined, the analysis is performed several times and the mean value is used as an estimate for the true alcohol level. In this approach, random errors will cancel out: the mean value will approximate the true value. Systematic errors, however, lead to a biased approximation of the true alcohol value, because those errors do not cancel out.
Question: Which type of error usually occurs more frequently?
In the field of statistics, the terms of precision and accuracy are used to indicate the quality of a set of measurements and they say something about the type of measurement error that influences the results.
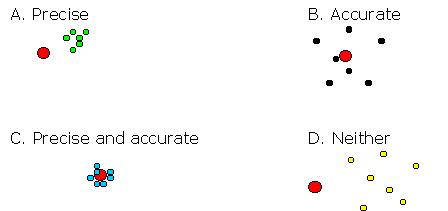
We now can distinguish four situations (see the figure below):
A. The experiments are carried out precise: the individual values found are very similar. However, their mean value differs from the true value: systematic errors are present in the analyses.
B. The experiments are carried out accurate: the individual values found are spread around the true value. No systematic error is present but the random errors can be rather large.
C. The experiments are carried out both precise and accurate: all measurements are very similar and their mean value lies close to the true value. This is the desired situation.
D. Neither accurate nor precise. Of course, these results are useless.
You can now continue with reading 'Background' (see 'Course Contents'-menu on top of this page or the menu on the right).